import torch import torchvision.models as models from torch.profiler import profile, record_function, ProfilerActivity
Resnet model
以 resnet 为例。创建 resnet 模型实例,初始化一个 input
1 2
model = models.resnet18() inputs = torch.randn(5, 3, 224, 224)
Using profiler in CPU
1 2 3 4 5 6 7 8 9 10 11 12 13 14 15 16
import torch
import torchvision.models as models
from torch.profiler import profile, record_function, ProfilerActivity
model = models.resnet18() inputs = torch.randn(5, 3, 224, 224)
with profile( activities=[ProfilerActivity.CPU], record_shapes=False, profile_memory=False, ) as prof: with record_function("model_inference"): model(inputs)
--------------------------------- ------------ ------------ ------------ ------------ ------------ ------------ Name Self CPU % Self CPU CPU total % CPU total CPU time avg # of Calls --------------------------------- ------------ ------------ ------------ ------------ ------------ ------------ model_inference 3.85% 3.699ms 100.00% 96.039ms 96.039ms 1 aten::conv2d 0.12% 119.000us 65.86% 63.255ms 3.163ms 20 aten::convolution 0.41% 395.000us 65.74% 63.136ms 3.157ms 20 aten::_convolution 0.34% 322.000us 65.33% 62.741ms 3.137ms 20 aten::mkldnn_convolution 64.68% 62.118ms 64.99% 62.419ms 3.121ms 20 aten::batch_norm 0.08% 77.000us 15.54% 14.928ms 746.400us 20 aten::_batch_norm_impl_index 0.17% 159.000us 15.46% 14.851ms 742.550us 20 aten::native_batch_norm 15.12% 14.524ms 15.28% 14.673ms 733.650us 20 aten::max_pool2d 0.02% 20.000us 8.49% 8.157ms 8.157ms 1 aten::max_pool2d_with_indices 8.47% 8.137ms 8.47% 8.137ms 8.137ms 1 --------------------------------- ------------ ------------ ------------ ------------ ------------ ------------ Self CPU time total: 96.039ms
指标解释如下:
Name :函数名称
Self CPU % :不考虑函数嵌套,此函数的 CPU 占用率
Self CPU :不考虑函数嵌套,此函数的 CPU 占用时间
CPU total % :考虑函数嵌套,此函数的总 CPU 占用率
CPU total :考虑函数嵌套,此函数的总 CPU 占用时间
CPU time avg :此函数每次调用的平均用时
of Calls :此函数调用次数
Using profiler in GPU
1 2 3 4 5 6 7 8 9 10 11 12 13 14 15 16
import torch import torchvision.models as models from torch.profiler import profile, record_function, ProfilerActivity
model = models.resnet18().cuda() inputs = torch.randn(5, 3, 224, 224).cuda()
with profile( activities=[ProfilerActivity.CPU, ProfilerActivity.CUDA], record_shapes=False, profile_memory=False, ) as prof: with record_function("model_inference"): model(inputs)
---------------------------------  ------------  ------------  ------------  ------------  ------------  ------------  ------------  ------------  ------------  ------------
                             Name    Self CPU %      Self CPU   CPU total %     CPU total  CPU time avg     Self CUDA   Self CUDA %    CUDA total  CUDA time avg    # of Calls
---------------------------------  ------------  ------------  ------------  ------------  ------------  ------------  ------------  ------------  ------------  ------------
                  model_inference         0.86%       3.915ms       100.00%     452.950ms     452.950ms       2.276ms         0.50%     452.948ms     452.948ms             1
                     aten::conv2d         0.13%     597.000us        85.10%     385.469ms      19.273ms     175.000us         0.04%     384.578ms      19.229ms            20
                aten::convolution         0.17%     789.000us        84.97%     384.872ms      19.244ms     481.000us         0.11%     384.403ms      19.220ms            20
               aten::_convolution         2.19%       9.905ms        84.80%     384.083ms      19.204ms       9.736ms         2.15%     383.922ms      19.196ms            20
          aten::cudnn_convolution        82.61%     374.178ms        82.61%     374.178ms      18.709ms     374.186ms        82.61%     374.186ms      18.709ms            20
                 aten::batch_norm         0.05%     208.000us         4.78%      21.663ms       1.083ms     118.000us         0.03%      23.597ms       1.180ms            20
     aten::_batch_norm_impl_index         0.25%       1.124ms         4.74%      21.455ms       1.073ms     806.000us         0.18%      23.479ms       1.174ms            20
           aten::cudnn_batch_norm         4.14%      18.733ms         4.49%      20.331ms       1.017ms      18.819ms         4.15%      22.673ms       1.134ms            20
                     aten::linear         0.02%      70.000us         3.64%      16.474ms      16.474ms      58.000us         0.01%      16.481ms      16.481ms             1
                      aten::addmm         3.58%      16.215ms         3.60%      16.289ms      16.289ms      16.226ms         3.58%      16.304ms      16.304ms             1
---------------------------------  ------------  ------------  ------------  ------------  ------------  ------------  ------------  ------------  ------------  ------------
Self CPU time total: 452.950ms
Self CUDA time total: 452.948ms
指标解释同 CPU 类似,不赘述
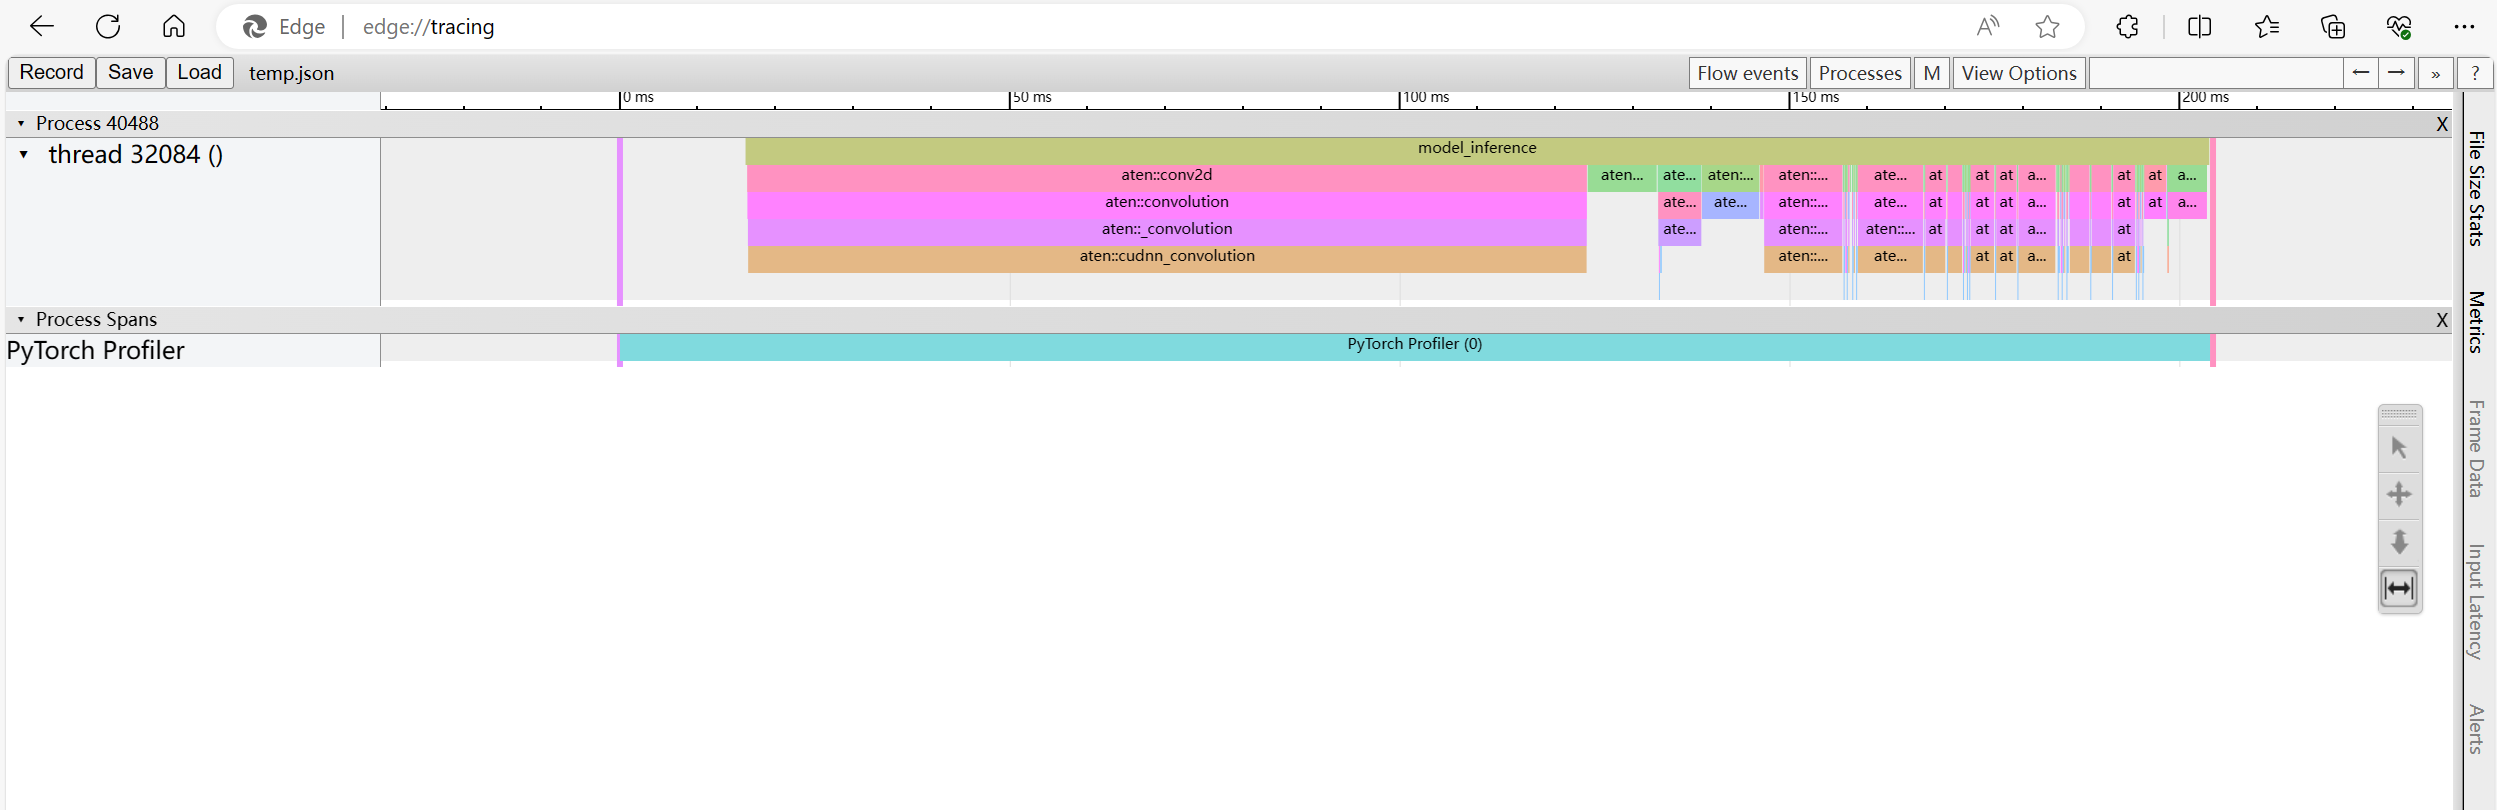
Export tracing file
Profiler 可以将分析结果导出为.json文件
1
2
3
4
5
6
7
8
9
10
11
12
model = models.resnet18().cuda() inputs = torch.randn(5, 3, 224, 224).cuda()
with profile( activities=[ProfilerActivity.CPU, ProfilerActivity.CUDA], record_shapes=False, profile_memory=False, ) as prof: with record_function("model_inference"): model(inputs)
 wechat